
Selecting an outsourcing partner is one of the few enterprise decisions where the volume of available information makes the decision harder rather than easier. There is no shortage of suppliers, rankings or case studies. What is missing is any reliable way to tell two capable-looking suppliers apart. Buyers usually discover this about six weeks in, when the shortlist is assembled, the presentations have been sat through, and every supplier has answered every question with a version of yes. What follows is a practical account of the three problems that make this decision difficult, and what a buyer can do about each one.
Problem one: the field has no edges, and everyone claims the same ground
Start with the size of the universe, because it sets up everything that follows. There is no authoritative register of outsourcing providers. The public directories list thousands, the market was worth 303 billion dollars in 2024 and is projected to pass 525 billion by 2030, and new entrants arrive constantly because the barriers to describing yourself as a BPO are close to zero. A buyer opening this market for the first time is not choosing from a defined set. They are sampling an unbounded one, usually through whichever suppliers their network happens to surface.
Cutting the market by geography, which is the first move most buyers make, does not shrink it either. NASSCOM represents more than 3,000 member companies in India. Published counts of Philippine providers run between roughly 700 and 1,200, so more than a thousand is a fair working figure, with over 400 inside IBPAP alone. Latin America and Africa publish no regional count at all, so Scale Edge estimates them at more than 500 and more than 200 providers. Colombia by itself holds more than 100 in its association BPrO, and Brazil is over 30 percent of the regional market. Seven African countries now sit inside the world's top 25 outsourcing destinations, and not one of them publishes how many providers operate there.
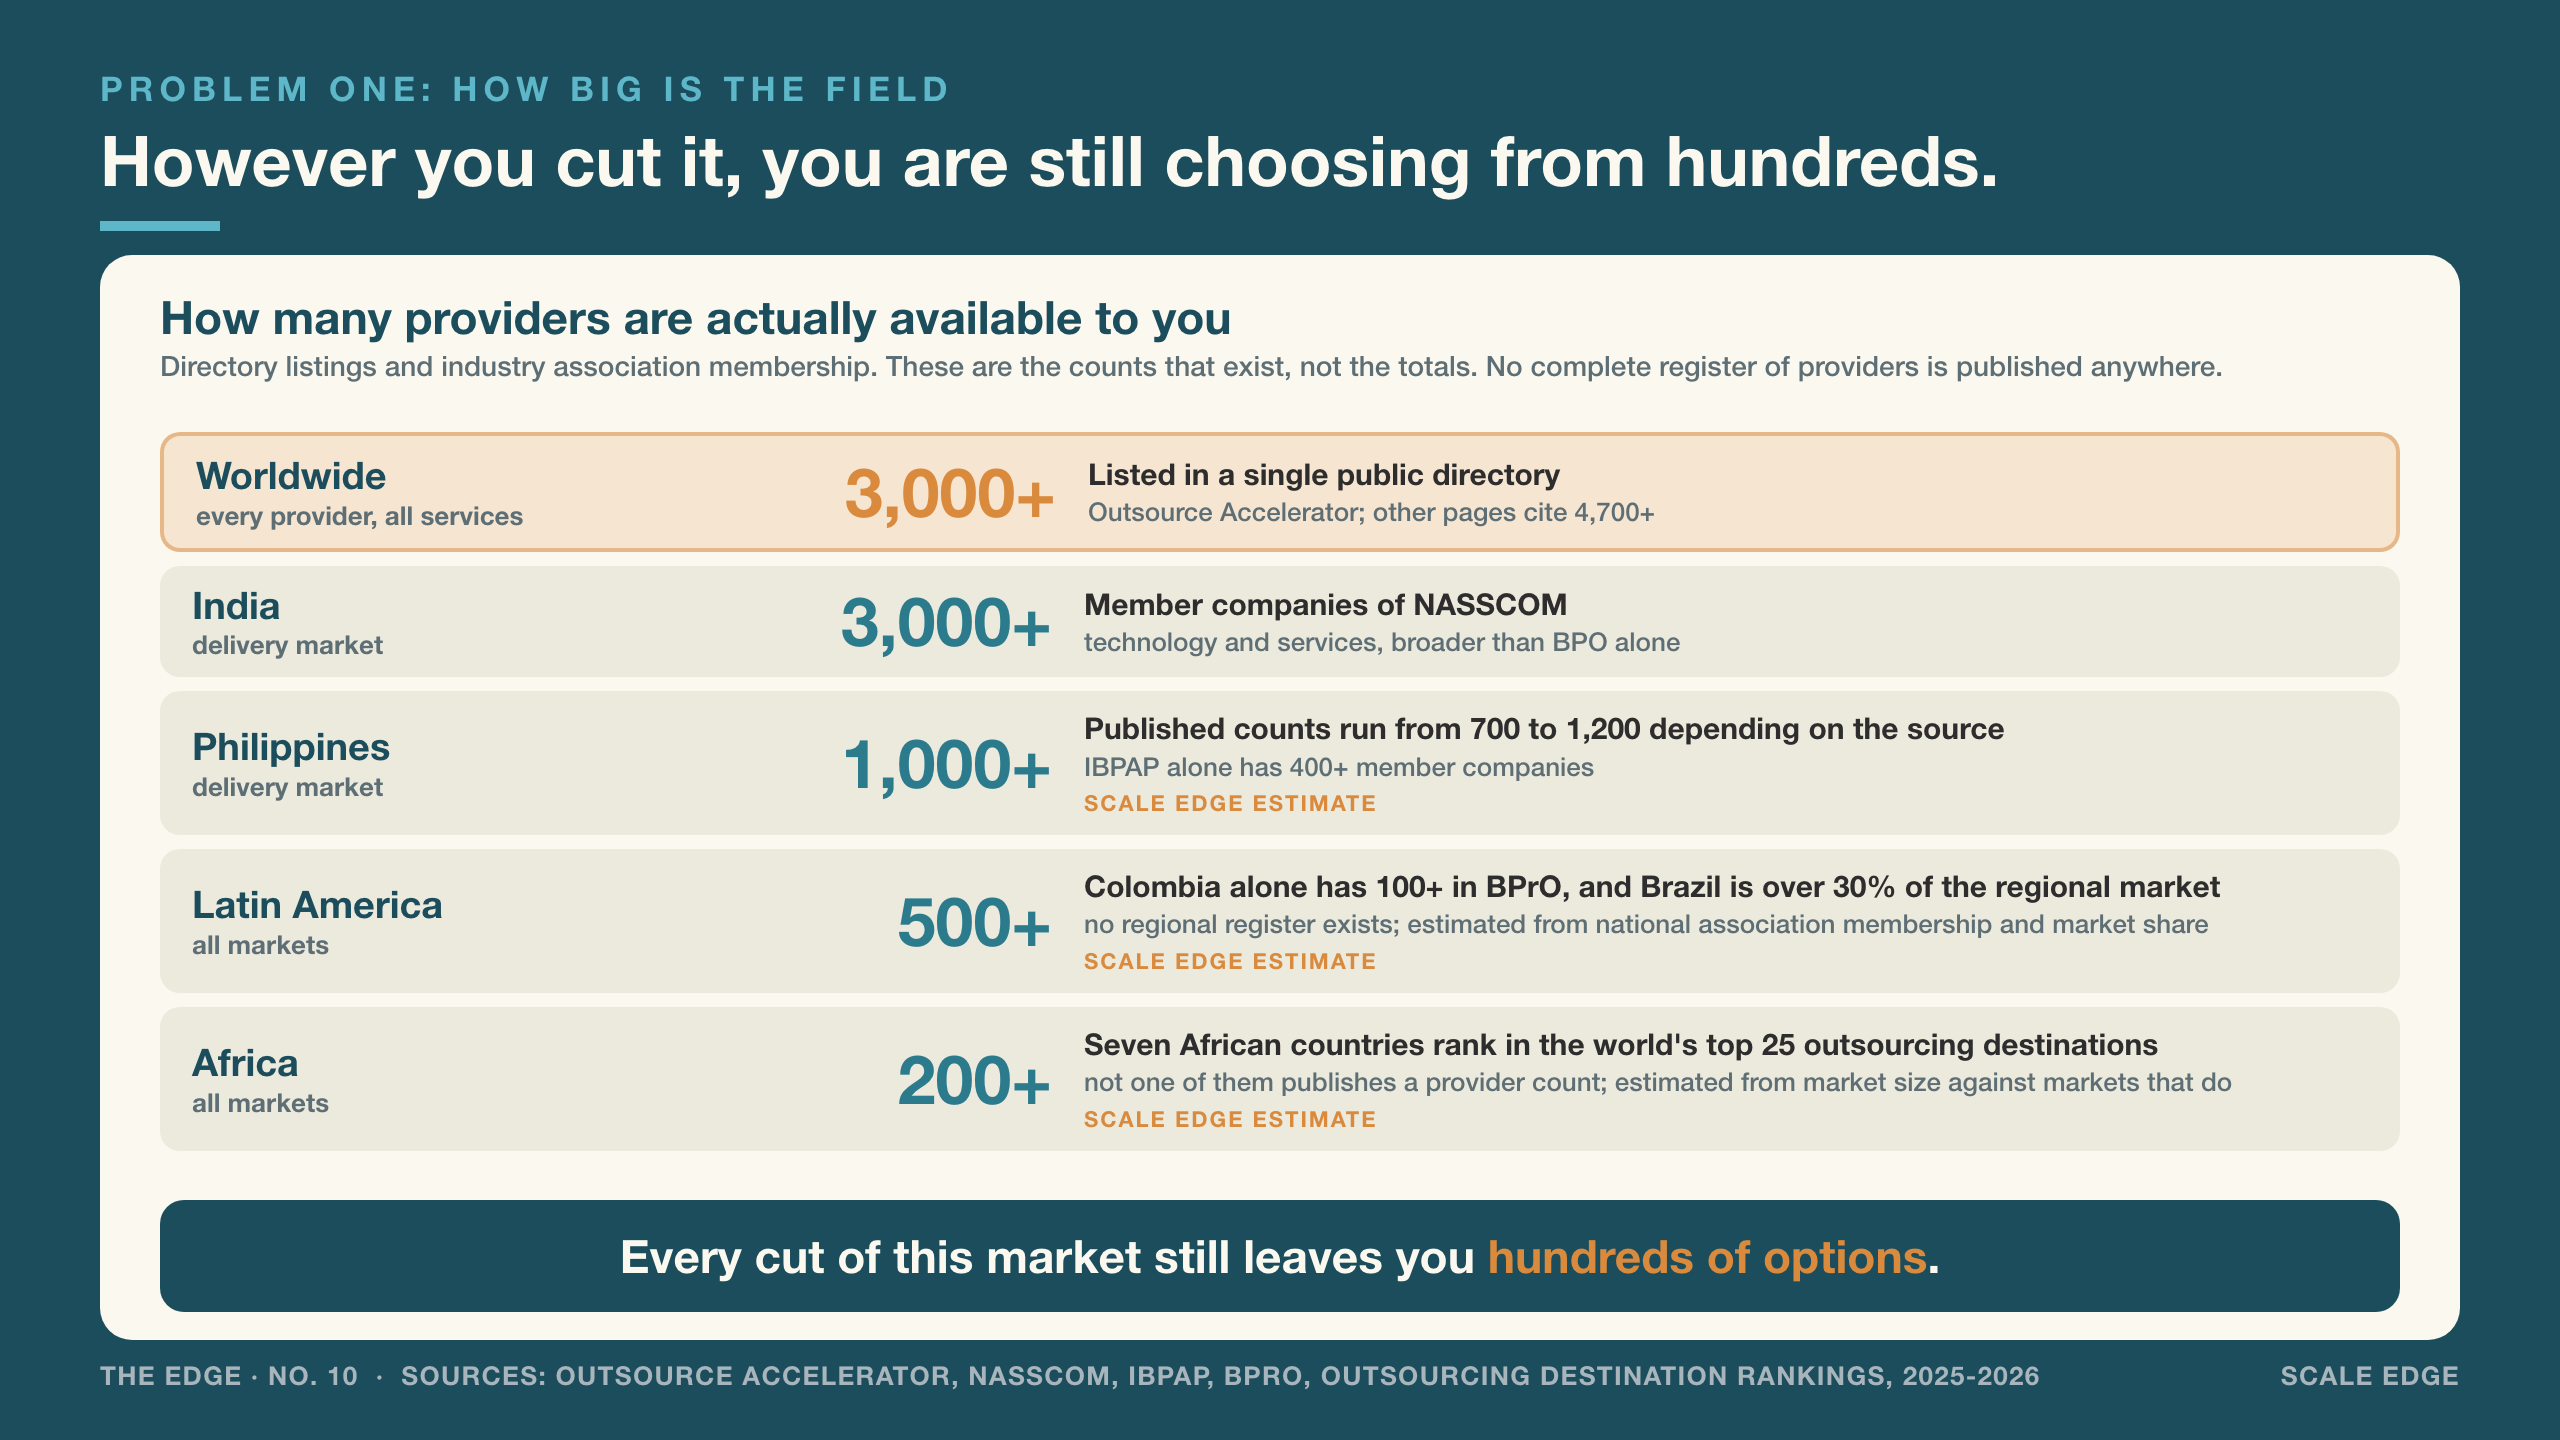
Every one of those is a floor rather than a total. Association membership is voluntary and the estimates are deliberately conservative, so the real figures run higher. No cut of this market, by geography, by service or by size, delivers a field a buyer can reasonably examine. There is always another hundred behind the ones being shown.
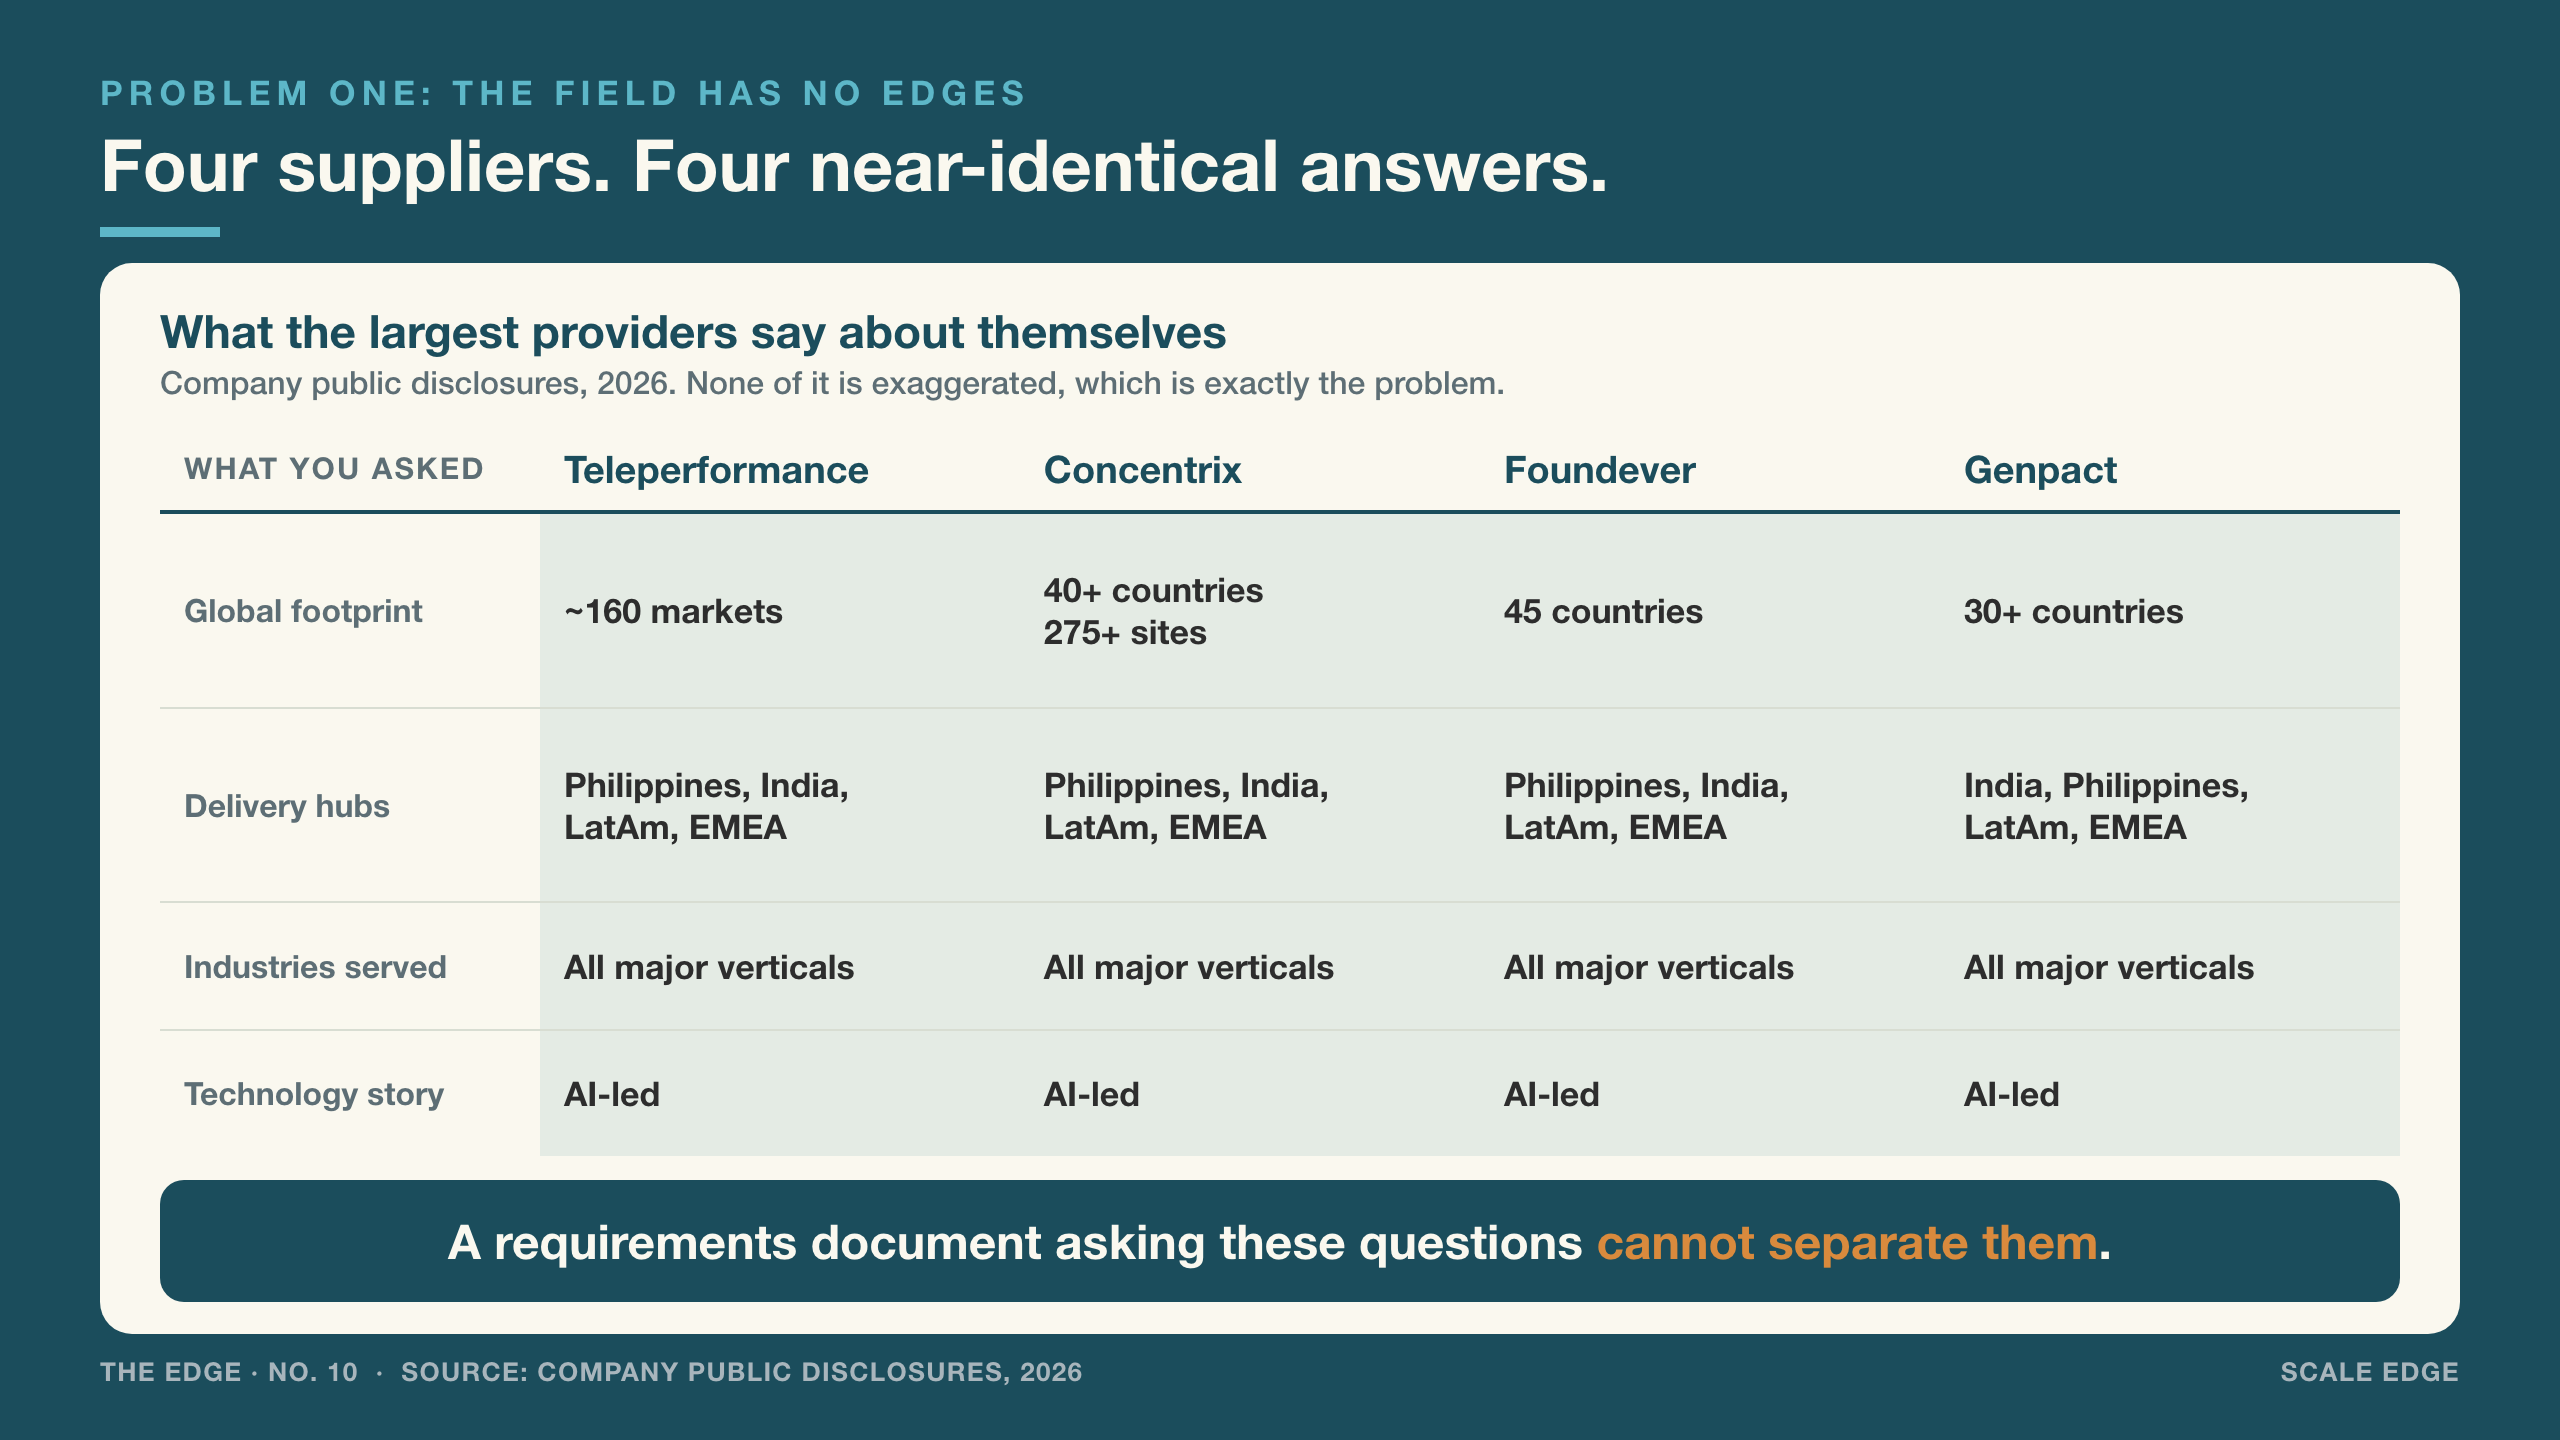
The second instinct is to go to the top of the market, where the largest suppliers look safest and the shortlist appears to write itself. That does narrow the field, and it introduces the second half of the problem, because across the largest providers the claims converge almost completely. Teleperformance describes a presence in around 160 markets. Concentrix describes more than 275 locations across more than 40 countries. Foundever describes 45 countries. Genpact describes more than 30. All deliver from the same offshore and nearshore hubs, all serve the same industries, and since 2024 all lead with artificial intelligence. None of that is exaggeration. It is what consolidation produces: Sitel and Sykes became Foundever, Concentrix absorbed Webhelp, Capgemini took WNS. They sound the same because, at the level a requirements document asks about, they largely are.
The guidance. Stop segmenting by size and start segmenting by the shape of the work. Size only tells a buyer that a supplier can absorb their volume, which is rarely the binding constraint and is usually true of everyone on the shortlist. What matters is whether the supplier has been contracted, by someone, to do this specific kind of work at a comparable complexity. Not whether they serve the industry, which almost everyone does. A supplier with fifteen years in healthcare that has only ever run inbound member enquiries is not experienced in claims adjudication, and the industry label conceals that completely. Cutting this way usually reduces a plausible list of twenty to a real list of four or five, on a criterion no supplier can answer with a generic yes.
Problem two: the grids that promise to sort the field are measuring size
Every buyer at this point reaches for the published rankings, and they are genuinely useful, so the criticism that follows is narrow and structural rather than a complaint about quality. Everest Group's PEAK Matrix and Gartner's Magic Quadrant are the most commonly used, and both are built on two axes. Everest assesses providers on Market Impact, defined as revenue, growth trajectory and value delivered, and on Vision and Capability, covering innovation, breadth of services, delivery footprint and strategy. Providers are then sorted into Leaders, Major Contenders and Aspirants.
Read those criteria from a buyer's seat. Revenue is scale. Breadth of services is scale. Delivery footprint is scale. Growth trajectory is scale in motion. A supplier that is large, broad and present everywhere will score well on most of the published inputs, and it will deserve to, because those are real attributes and the grid measures them accurately. What the grid answers is who is big, broad and safe. That is a legitimate question. It is not the same question as whether a supplier is right for a particular programme, and the two get conflated because the output looks like a ranking of quality rather than a map of scale.
There is a second structural feature worth understanding, and it is not an accusation. Analyst grids are read far more often as vendor marketing than as buyer research, because vendors license the right to use them. Gartner sells reprint rights separately to vendors reproducing the graphic, and Everest requires providers to license PEAK Matrix badges before using them in their own materials. The research is produced independently of that, and the counterweight deserves stating: Gartner does more business with enterprise buyers than with technology vendors, and would remain a business of well over a billion dollars with no vendor revenue at all. The practical consequence is that most grid content reaching a buyer arrives inside a supplier's pitch pack, already selected because it flatters.
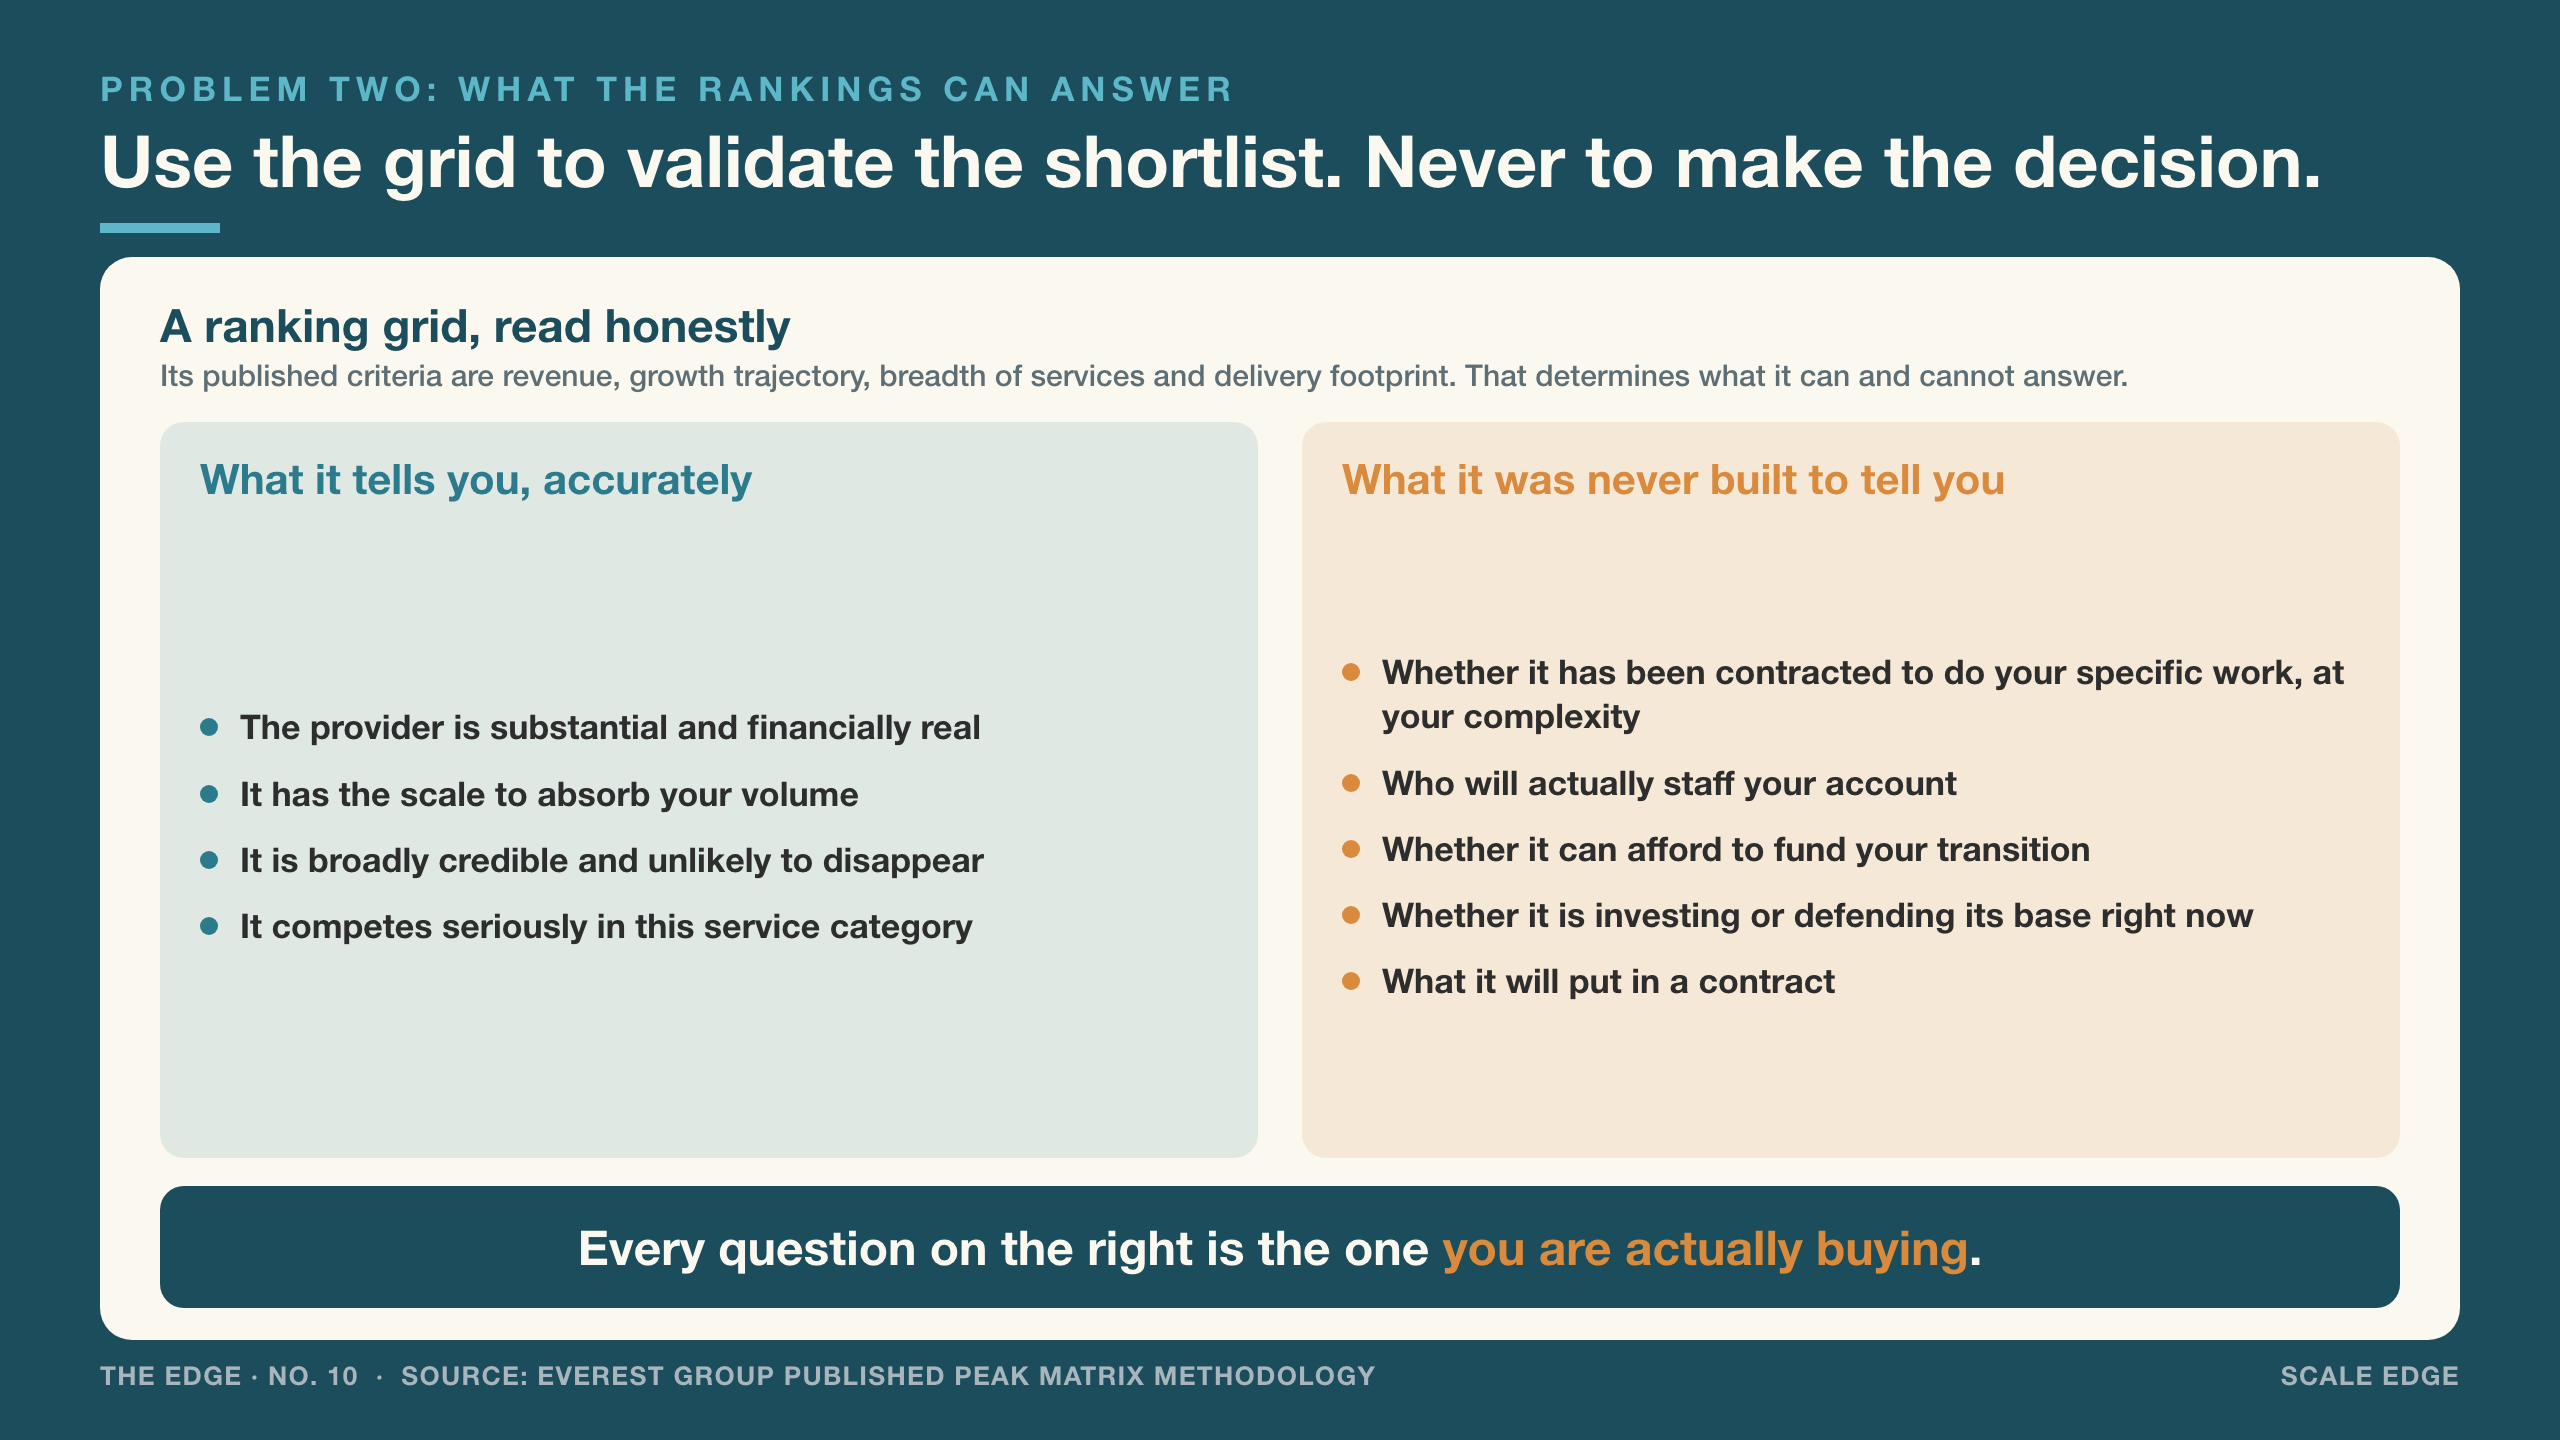
The guidance. Use the grids as a filter and never as a decision. They are well suited to establishing that a supplier is substantial, financially real and unlikely to disappear, which is worth settling early. They are not designed to tell a buyer which supplier will do their particular work well, and they do not claim to. Use the grid to confirm the shortlist is credible, then set it aside before the evaluation proper starts. When a supplier presents its own position on one, ask which assessment, which year, which service category, and where the others landed. A leader position in one narrow category two years ago is a legitimate achievement and a poor reason to select anyone today. Scale Edge has an obvious interest in this argument, being in the analysis business itself, and that is stated here rather than left implied.
Problem three: the supplier in front of you is not the company it was three years ago
The third problem is the one buyers most often skip, and it has become the most consequential. A selection process examines capability, references and price, and treats the supplier as a fixed object. It is not. It is a business under its own financial pressures, and those pressures determine what it can afford to do for a new client. The largest providers publish this information, which makes it the most accessible unexploited evidence in the entire process.
Consider three of the largest, all presenting near-identical capability. Genpact reported first-quarter 2026 revenue up 6.7 percent, guided to at least 7 percent growth for the year, at an adjusted operating margin of around 17.7 percent. Teleperformance reported first-quarter revenue down 2.2 percent like-for-like, guided to 0 to 2 percent growth at a recurring EBITA margin of 14.6 percent, and is running a restructuring programme to fund its savings target. Concentrix reported second-quarter revenue up 0.6 percent at constant currency, with adjusted EBITDA margin at 14.1 percent against 14.8 percent a year earlier, and cut both its revenue and its earnings guidance. The reason it gave for the cut is worth reading twice: an accelerating shift of client work to offshore locations.
The market has priced these differences over years, not days. Teleperformance peaked at 354.26 euros in January 2022 and trades near 60, after five consecutive negative years. Concentrix peaked at 194.46 dollars in February 2022 and trades near 25. Genpact peaked more recently, at 55.13 dollars in February 2025, and trades near 34. The sector as a whole has de-rated, so the point is not that some suppliers are winning and others losing. It is that the distance between a supplier growing at 7 percent on a 17.7 percent margin and one flat at 14.1 percent and falling is enormous, and none of it shows up in a capability presentation.
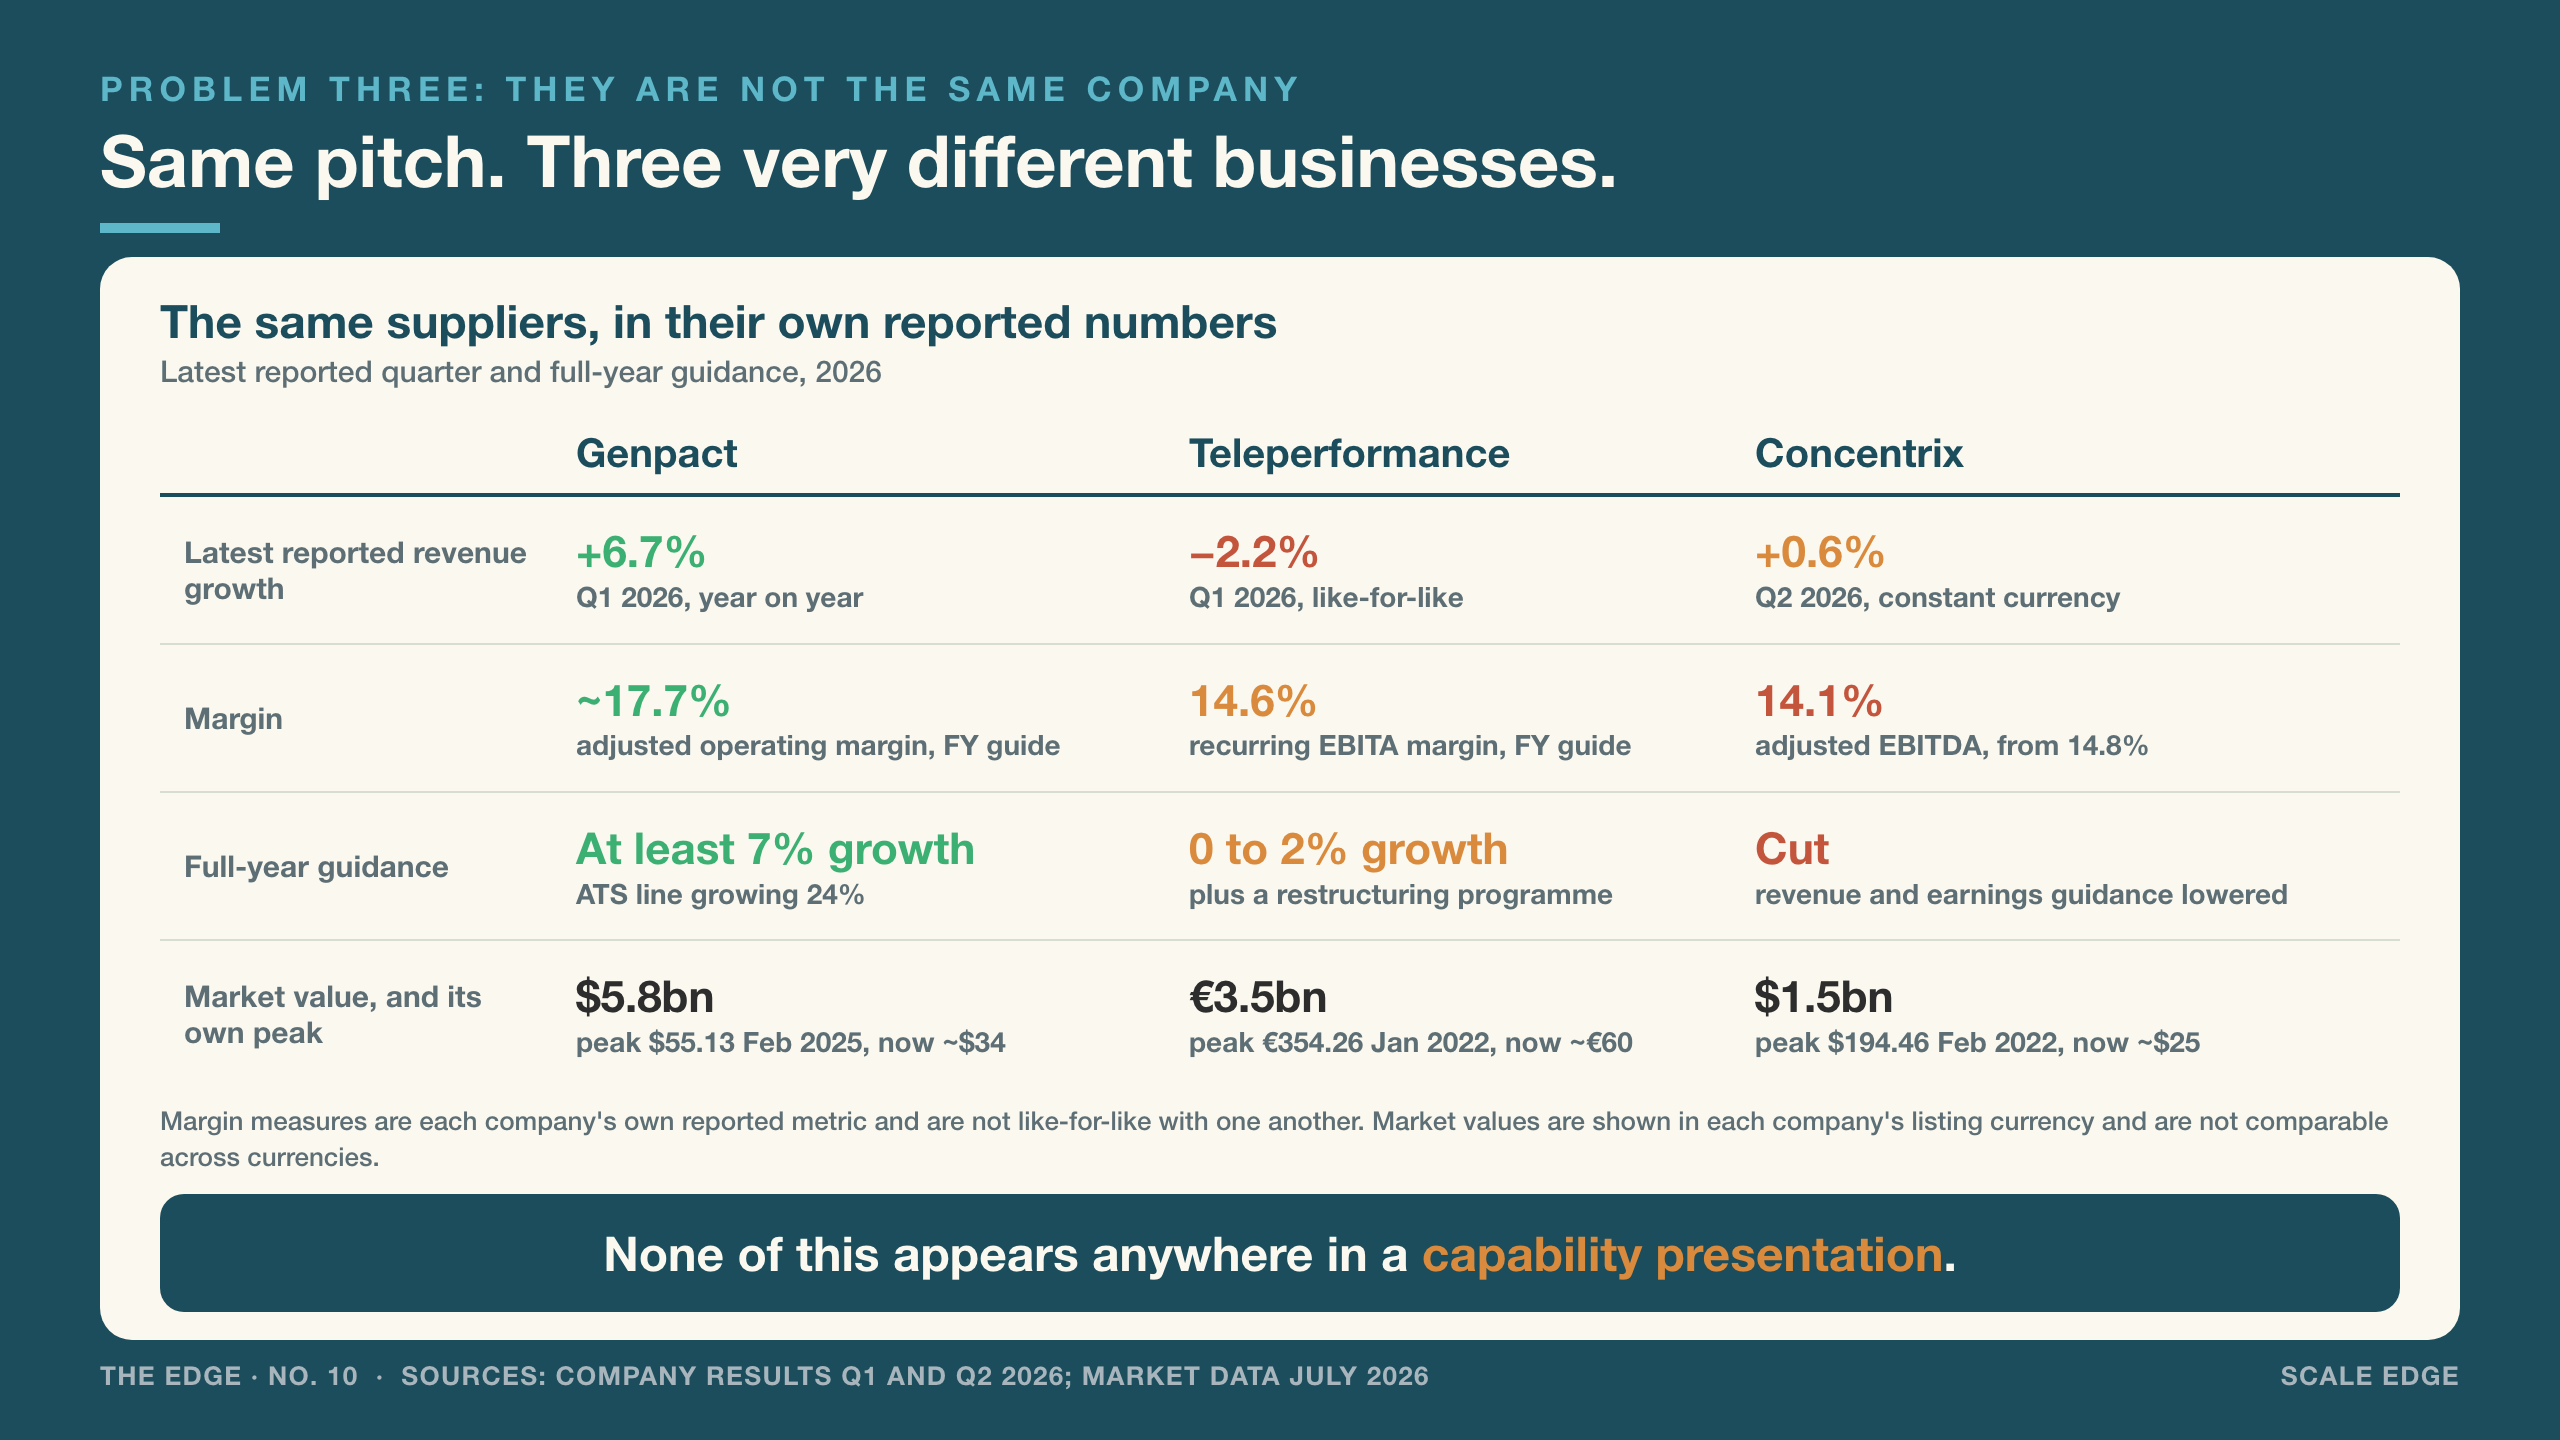
Every supplier on the shortlist can describe the same capability. Not one of them can describe the same balance sheet, and only one of those two documents predicts what they will actually be able to do for you.
The guidance. Read the accounts before the references. For a listed provider the question is not whether the share price fell, since almost all of them have. It is whether the underlying business is still growing and still earning enough to fund investment, because a leadership team under sustained margin pressure is compensated to protect margin this year. That is arithmetic, not character, and it determines whether they can fund the transition being asked of them, whether the account is staffed with senior people or available people, and whether they can carry any commercial risk on an outcome. Concentrix's own stated reason for cutting guidance, clients accelerating a move offshore, shows that pressure already being passed into the delivery model.
For a private provider, which is a large share of the market, the same question needs different instruments. Foundever, built from the merger of Sitel and Sykes and domiciled in Luxembourg, has no share price to read at all. What can be read is the filed accounts in the domicile, any credit rating and the maturity profile of the debt, how far a private equity owner is into its holding period, site openings against closures, redundancy notices, leadership turnover, and whether the supplier is hiring in the location being proposed. Then ask the supplier directly. The answer matters, and so does the willingness to give one.
The five moves
Three problems, five practical moves.
1. Cut the field by the shape of the work, not the size of the supplier. Ask for the three most complex pieces of work the supplier has been contracted to deliver in the specific area being bought, and who can confirm it. Industry experience is a label almost everyone can claim. Contracted complexity is not.
2. Use the analyst grids to validate the shortlist, then close them. Confirm the supplier is substantial and real, which the grids do well, then run the evaluation on the criteria that actually apply to the programme.
3. Interrogate every ranking claim a supplier presents. Which assessment, which year, which service category, and where did the others place. The follow-up questions do more work than the badge.
4. Read the financial position before the reference calls. Growth, margin, guidance direction and investment capacity for the listed. Filed accounts, ratings, ownership stage, hiring and leadership stability for the private. Fifteen minutes on this changes more decisions than a site visit.
5. Ask what they invested in this year and what it cost them. A supplier with headroom will answer with specifics and a number. A supplier protecting margin will answer with a roadmap. The difference between those two answers is the difference between a partner who can fund your transition and one who cannot.
From the Network
The three problems here are structural. The field has no edges, the ranking instruments measure scale because scale is measurable, and a supplier's financial position moves faster than any evaluation cycle captures. None of that is going to change. What a buyer can change is how much of the decision rests on a claim nobody has checked. Scale Edge exists to do that checking: to establish independently what a supplier has actually been contracted to do, what it can evidence rather than assert, and what its current position allows it to commit to. The method behind that is proprietary and stays that way. The principle is not, and it is the argument of this edition. No supplier pays Scale Edge to be listed, rated or recommended.
One move this week
Take the shortlist currently on the table and spend fifteen minutes on the financial position of each supplier on it. Last reported growth, last reported margin, whether guidance was raised or cut, and for the private ones whether the accounts are filed and what they show. Then put that page next to the capability presentations. Most buyers find that the suppliers were nearly identical on the documents they were given and are not remotely identical on the documents they were not.
Independent intelligence for the buy side of outsourcing. No vendor sponsorship, no commissions, no agenda except yours. Scale Edge establishes what a supplier has genuinely been contracted to do, verifies what it can prove rather than claim, and tells a buyer what its current position allows it to deliver.
If you are selecting, renewing, or rethinking an outsourcing relationship this year, talk to someone independent before you sign. <a class="inl" href="contact.html">Talk to someone independent</a>.
**
--- ---
Sources
Global BPO market USD 303bn (2024), projected to exceed USD 525bn by 2030 at 9.8% CAGR: Grand View Research. House figure: same numbers used in the Innovation Norway solution document and the platform report template. Do NOT use the 280.6bn 2023 baseline, which is the first row of the same series and three years stale. No authoritative register of providers; public directories list thousands: Stated as an absence, supported by directory listings (Clutch, Outsource Accelerator). Worldwide: one public directory lists 3,000+ BPO firms (other pages on the same site cite 4,700+): Outsource Accelerator BPO directory. India: NASSCOM represents 3,000+ member companies across technology and services, broader than BPO alone: NASSCOM. Philippines 1,000+ providers (SCALE EDGE ESTIMATE, labelled as such on the visual; published counts run ~700 to 1,200 depending on source, so 1,000+ is the working figure); IBPAP has 400+ member companies and six partner associations; CC-BPM sector revenue $35.7bn expected 2026 (from $33.9bn in 2025): IBPAP; CXAP (formerly CCAP); Philippine industry reporting 2026. Latin America 500+ providers: SCALE EDGE ESTIMATE, labelled as such on the visual. No regional register exists. Derived two ways: (a) Colombia has 100+ in BPrO and is a mid-size regional market, with Brazil at 30%+ of regional revenue and Mexico also larger; (b) LatAm BPO market ~USD 14.1bn (2024) scaled against the Philippines, where the contact-centre and BPM subsector at ~USD 35.7bn supports 700-1,200 providers. NOTE: this is the CC-BPM subsector figure, not the ~USD 40bn full IT-BPM export figure cited in Edition 08; the two measure different things and should not be presented side by side. Method (a) implies 600-1,000, method (b) implies ~375. 500+ is the conservative floor. Sources: BPrO; ALOIC; Grand View / Cognitive Market Research for LatAm market size. Africa 200+ providers: SCALE EDGE ESTIMATE, labelled as such on the visual. No provider count published in any African market. Derived from continental BPO market ~USD 8.9bn (South Africa 42.5% / USD 3.76bn, Nigeria 25.2% / USD 2.23bn, rest 32.3%) scaled against the same Philippines CC-BPM ratio, implying ~235. Stated as 200+. Seven African countries rank in the top 25 of the 2026 Global Outsourcing Talent Index (South Africa, Nigeria, Kenya, Egypt, Ghana, Ethiopia, Uganda), 28% of the global top 25: 2026 Global Outsourcing Talent Index, via industry reporting. NOTE: secondary source, not verified at primary level. South Africa: BPESA reports 180,000 sector jobs created over ten years and 26,346 new roles filled in 2025, and publishes no provider count: BPESA. Teleperformance presence in around 160 markets: Teleperformance public disclosure. Concentrix 275+ locations in 40+ countries; ~265,000 staff, ~80,000 in the Philippines: Concentrix public disclosure / locations page. Foundever operations in 45 countries, 750+ clients; formed from Sitel and Sykes merger (2021); privately held, Luxembourg; revenue ~USD 4bn (2023): Foundever public disclosure; company record. Genpact operations in 30+ countries: Genpact public disclosure. Consolidation: Sitel + Sykes = Foundever; Concentrix + Webhelp; Capgemini + WNS (Oct 2025): Public M&A record. PEAK Matrix axes: Market Impact (revenue, growth trajectory, value delivered) and Vision and Capability (innovation, breadth of services, delivery footprint, strategy); categories Leaders / Major Contenders / Aspirants: Everest Group published PEAK Matrix methodology. Providers must obtain licensing and distribution rights from Everest Group to use PEAK Matrix badges and positioning in marketing: Everest Group Research Citation Guidelines. Gartner sells reprint licences separately to vendors wishing to reproduce Magic Quadrant graphics: Gartner Magic Quadrant policy guidelines. Gartner does more business with enterprise buyers than with technology vendors; would remain a business of well over USD 1bn with no vendor revenue: Knowledge Capital Group analysis, via IIAR. Genpact Q1 2026: revenue USD 1.296bn, +6.7% YoY; FY2026 guidance at least 7% growth; ATS +24%, 27% of net revenue; adjusted operating margin ~17.7%: Genpact Q1 2026 results, 7 May 2026. Teleperformance Q1 2026: revenue EUR 2.433bn, -2.2% like-for-like, -6.9% reported; FY2026 guidance 0-2% like-for-like, recurring EBITA margin 14.6%; efficiency programme targeting EUR 100m+ annual savings at EUR 70-90m restructuring cost: Teleperformance Q1 2026 revenue release. Concentrix Q2 2026: revenue USD 2,462.5m, +1.9% reported / +0.6% constant currency; adjusted EBITDA USD 347.4m = 14.1% of revenue vs 14.8% prior year; FY revenue guidance cut to USD 9.925-10.025bn; FY adjusted EPS guidance cut 6.5% to USD 11.00 midpoint; cut attributed to accelerating mix shift to offshore locations: Concentrix Q2 2026 results, 29 June 2026. Teleperformance peak EUR 354.26 (3 Jan 2022), recent ~EUR 60, market value ~EUR 3.5bn, five consecutive negative years (2022 to 2026 YTD): Market data, July 2026. Concentrix peak USD 194.46 (9 Feb 2022), recent ~USD 25, market value ~USD 1.5bn: Market data, July 2026. Genpact peak USD 55.13 (13 Feb 2025), recent ~USD 34, market value ~USD 5.8bn: Market data, July 2026.